Prometheus

pip install kpireport-prometheus
The Prometheus plugin provides both a Datasource capable of returning PromQL query results and a View that summarizes alerts fired by the Prometheus server over the report interval.
Datasource
Show/hide example configuration YAML
datasources:
   prom:
      plugin: prometheus
      args:
         host: prometheus:9090
views:
   # Using Plot plugin to graph data
   server_load:
      plugin: plot
      title: Load
      args:
         datasource: prom
         query: |
         100 - (avg by(hostname) (irate(node_cpu_seconds_total{mode="idle"}[5m])) * 100
Alert summary
Show/hide example configuration YAML
critical_alerts:
   plugin: prometheus.alert_summary
   title: Critical alerts
   args:
      datasource: prom
      labels:
         severity: critical
warning_alerts:
   plugin: prometheus.alert_summary
   title: Warnings
   args:
      datasource: prom
      show_timeline: False
      labels:
         severity: warning
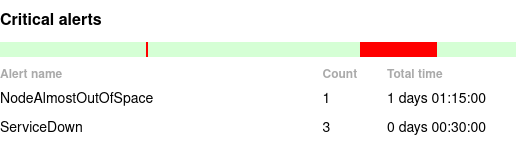
An example rendered alert summary. The timeline at the top displays the points in time when any alert was firing over the report window. Individual alert labels are not shown; the view’s purpose is to highlight trends or patterns that can be looked at in more detail at the source.
API
- class kpireport_prometheus.PrometheusDatasource(report: Report, **kwargs)
Bases:
DatasourceDatasource that executes PromQL queries against a Prometheus server.
- host
the hostname of the Prometheus server (may include port), e.g.,
https://prometheus.example.com:9090. If no protocol is given, “http://” is assumed.- Type
str
- basic_auth
HTTP Basic Auth credentials to use when authenticating to the server. Must be a dictionary with
usernameandpasswordkeys.- Type
dict
- query(query: str, step='1h') DataFrame
Execute a PromQL query against the Prometheus server.
- Parameters
query (str) – the PromQL query
step (str) – the step size for the range query. The Datasource will execute a range query over the report window and capture all time series data within the report boundaries. The step size indicates the query resolution. A lower value provides more granularity but at the cost of a more expensive query and more data points to analyze. If your report window is significantly short, it may make sense to reduce this.
- Returns
a table of time series results.
The timeseries value will be in a
timecolumn; any labels associated with the metric will be added as additional columns.- Return type
- class kpireport_prometheus.PrometheusAlertSummary(report: Report, datasources: DatasourceManager, **kwargs)
Bases:
ViewDisplay a list of alerts that fired recently.
Supported output formats:
html,md,slack- datasource
the ID of the Prometheus Datasource to query
- Type
str
- resolution
the size of the time window used to group alerts–the window is used to define buckets. A higher resolution is a lower time window (e.g., “5m” versus “1h”–“5m” is the higher resolution). Higher resolutions mean the timeline and time estimates for outage length will be more accurate, but may decrease performance when the report interval is large, as it requires pulling more data from Prometheus. (default
"15m")- Type
str
- hide_labels
a set of labels to hide from the output display. Alerts containing these labels will still be listed, but the label values will not be printed. (default
["instance", "job"])- Type
List[str]
- labels
a set of labels that the alert must contain in order to be displayed (default
None)- Type
Dict[str,str]
- ignore_labels
a set of labels that the alert must _not_ contain in order to be displayed (default
None)- Type
Dict[str,str]
- show_timeline
whether to show a visual timeline of when alerts were firing (default
True)- Type
bool
- timeline_height
rendered height of the timeline in pixels (default
15)- Type
int
Changelog
0.0.2
Bug Fixes
Fixes an issue where the alert summary timeline view would not render if datetimes included timezone information.
0.0.1
Prelude
Initial commit.
New Features
Initial commit.